반응형
rsi 계산에는 ewm의 개념이 들어가는데 이부분은 정확한 이해를 하지 못했다.
파이썬의 경우, DataFrame에 ewm이라는 함수를 사용한다.
RSI 계산하는 공식이다.
|
1
2
3
4
5
6
7
8
9
10
11
12
13
14
15
16
17
18
19
20
21
|
def calcRSI(self,stock_ds, date_index, ema=True):
close_delta = stock_ds['Close'].diff()
# Make two series: one for lower closes and one for higher closes
up = close_delta.clip(lower=0)
down = -1 * close_delta.clip(upper=0)
if ema:
# Use exponential moving average
ma_up = up.ewm(com=self.period - 1, adjust=True, min_periods=self.period).mean()
ma_down = down.ewm(com=self.period - 1, adjust=True, min_periods=self.period).mean()
else:
# Use simple moving average
ma_up = up.rolling(window=self.period, adjust=False).mean()
ma_down = down.rolling(window=self.period, adjust=False).mean()
rsi = ma_up / ma_down
rsi = 100 - (100 / (1 + rsi))
rsi = pd.DataFrame(rsi)
rsi.columns = ['rsi']
return rsi
|
cs |
ewm 함수는 아래에서 볼 수 있다.
https://pandas.pydata.org/pandas-docs/stable/reference/api/pandas.DataFrame.ewm.html
pandas.DataFrame.ewm — pandas 1.3.3 documentation
When ignore_na=True (reproducing pre-0.15.0 behavior), weights are based on relative positions. For example, the weights of \(x_0\) and \(x_2\) used in calculating the final weighted average of [\(x_0\), None, \(x_2\)] are \(1-\alpha\) and \(1\) if adjust=
pandas.pydata.org
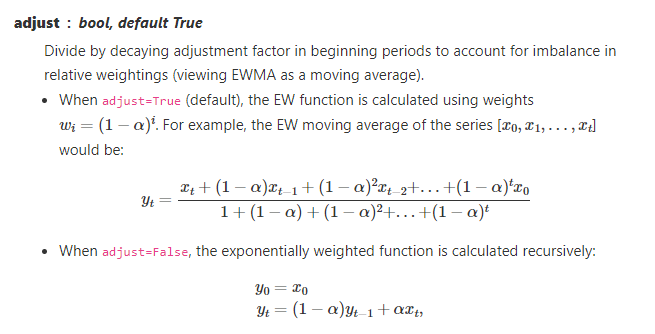
adjust의 함수는 이렇게 사용되는데, 대부분 엑셀을 통해 RSI를 계산하는 사이트를 보면 아래와 같은 공식을 사용한다.
하지만, 이는 무한대라는 가정하에 아래와 같은 공식이 나온다고 한다.
그래서 우리가 엑셀을 통해 만들기 위해서는 위와같은 공식을 사용해야한다.
아래는 RSI 계산식이다.
보통은 RSI 계산식의 기간은 14일이다. 그래서 13이 들어갔다.
| index | 날짜 | 종가 | 변화량 | gain | loss | avg gain | avg gain | RS | rsi |
| 1 | 2021. 6. 28 | 134.78 | 0 | ||||||
| 2 | 2021. 6. 29 | 136.33 | 1.55 | 1.55 | 0 | 0 | 0.49 | ||
| 3 | 2021. 6. 30 | 136.96 | 0.63 | 0.63 | 0 | 0.326666667 | 0.235925926 | ||
| 4 | 2021. 7. 1 | 137.27 | 0.31 | 0.31 | 0 | 0.320694698 | 0.151389397 | ||
| 5 | 2021. 7. 2 | 139.96 | 2.69 | 2.69 | 0 | 0.980397768 | 0.109236936 | ||
| 6 | 2021. 7. 3 | 142.02 | 2.06 | 2.06 | 0 | 1.229444488 | 0.084037747 | ||
| 7 | 2021. 7. 4 | 144.57 | 2.55 | 2.55 | 0 | 1.492225911 | 0.067314816 | 22.168 | 95.684 |
| 8 | 2021. 7. 5 | 143.24 | -1.33 | 0 | 1.33 | 1.228877214 | 0.290154062 | 4.235 | 80.899 |
| 9 | 2021. 7. 6 | 145.11 | 1.87 | 1.87 | 0 | 1.331266648 | 0.243815497 | 5.46 | 84.52 |
| 10 | 2021. 7. 7 | 144.5 | -0.61 | 0 | 0.61 | 1.135904496 | 0.297552735 | 3.817 | 79.242 |
| 11 | 2021. 7. 8 | 145.64 | 1.14 | 1.14 | 0 | 1.13646341 | 0.256945689 | 4.423 | 81.56 |
| 12 | 2021. 7. 9 | 149.15 | 3.51 | 3.51 | 0 | 1.440598722 | 0.224021715 | 6.431 | 86.542 |
| 13 | 2021. 7. 10 | 148.48 | -0.67 | 0 | 0.67 | 1.265912275 | 0.27810087 | 4.552 | 81.988 |
| 14 | 2021. 7. 11 | 146.39 | -2.09 | 0 | 2.09 | 1.119694428 | 0.487382347 | 2.297 | 69.673 |
| 15 | 2021. 7. 12 | 142.45 | -3.94 | 0 | 3.94 | 0.99582491 | 0.869338416 | 1.145 | 53.391 |
| if(D16>0,D16,0) | if(D16>0,D16,0) | (E16*1/(1+13)+G15*(1-(1-1/(1+13))^(A16-1))*(1-(1/(1+13))))/(1-(1-1/(1+13))^A16) | (F16*1/(1+13)+H15*(1-(1-1/(1+13))^(A16-1))*(1-(1/(1+13))))/(1-(1-1/(1+13))^A16) | G16/H16 | 100-(100/(I16+1)) |
정확한 이해가 필요하면 통계박사를 찾아가면 된다.
반응형
'투자 > 개발' 카테고리의 다른 글
| Google Sheets를 이용한 자동 메일 (0) | 2021.09.06 |
|---|---|
| 네이버 증권을 이용한 주식 테마 정리하기 (4) | 2021.08.22 |